
The Science
Two Decades of Independent Trials
Bio-Agtive's technology solubilizes and upcycles engine emissions from your working farm equipment, treating your seeds with solubilized carbon in the same motion as you plant them. That single point of contact is the exit ramp off a season-after-season dependency on ag supply, onto a farm that runs on what it consumes, grows, and cycles for itself.
01 — The Trial Record
The same yield outcomes, at every independent check on Bio-Agtive.
National Research Council of Canada, Montana State University Northern, Olds College Smart Farm, the University of Calgary, a 2024 endorsement from Coors Brewing Company — the pattern holds everywhere. A grower can pull the conventional fertility stack and still stand on equal ground at harvest.
2009
NRC / IRAP
Strome, AB
Peas, oats, wheat — four-treatment replicated trial
Wheat yield under emissions treatment and under fertilizer both outperformed the unfertilized check, with no meaningful difference between the two. Oat yield showed a statistically significant difference between Bio-Agtive, fertilizer and the check.
Dryland pea yield by treatment (Bu/acre)
NRC / IRAP, Strome AB (2009). Converted from lbs/acre (1,000 / 840 / 760) at 60 lb/bu.
Dryland oat & wheat yield by treatment (Bu/acre)
NRC / IRAP, Strome AB (2009).
2022
Olds College Smart Farm
Pasture
Bio-Agtive Carbon Water vs. granular fertilizer vs. no-input control
ANOVA found no statistically significant difference in forage yield between any of the three treatments. δ15N nitrogen ratios in June forage were measurably higher under Bio-Agtive, consistent with a biological rather than synthetic nitrogen source.
Forage: Bio-Agtive Carbon Water vs. Fertilizer vs. No-Input Control (g per 0.25 m² sample)
Maki, Olds College Smart Farm (2022).
2023
University of Calgary / AGU
Strathmore — oats & barley
Irrigated grain trials (Barley & Oats)
Irrigated grain trials, 3 field treatments, each with manure as the control. Bio-Agtive outyielded fertilizer in barley and oats, with a yield profile that tracked closer to manure than to fertilizer.
Irrigated barley & oat yield by treatment (Bu/acre)
University of Calgary / AGU, Strathmore (2023).
Cost (Fertility only) to treat (CAD $/acre)
Approximate Bio-Agtive Carbon Water (BCW) cost vs. other treatments per acre.
2024
University of Calgary
Farm Trial, Year 2
Irrigated Hard Red Spring Wheat, side-by-side field comparison
104 bushels/acre under Bio-Agtive against 101 bushels/acre under synthetic fertilizer, within 3%, with little to no lodging observed in the Bio-Agtive field.
Irrigated Hard Red Spring Wheat — Bu/acre
University of Calgary Carbon Summer Team (2024). Manure control value approximate.
Cost (Fertility only) to treat (CAD $/acre)
Approximate Bio-Agtive Carbon Water (BCW) cost vs. other treatments per acre.
Bio-Agtive wins back your farm independence without compromising yield performance.
02 — The Moment of Contact
Start with the seed, in real time, and most importantly... while you seed.
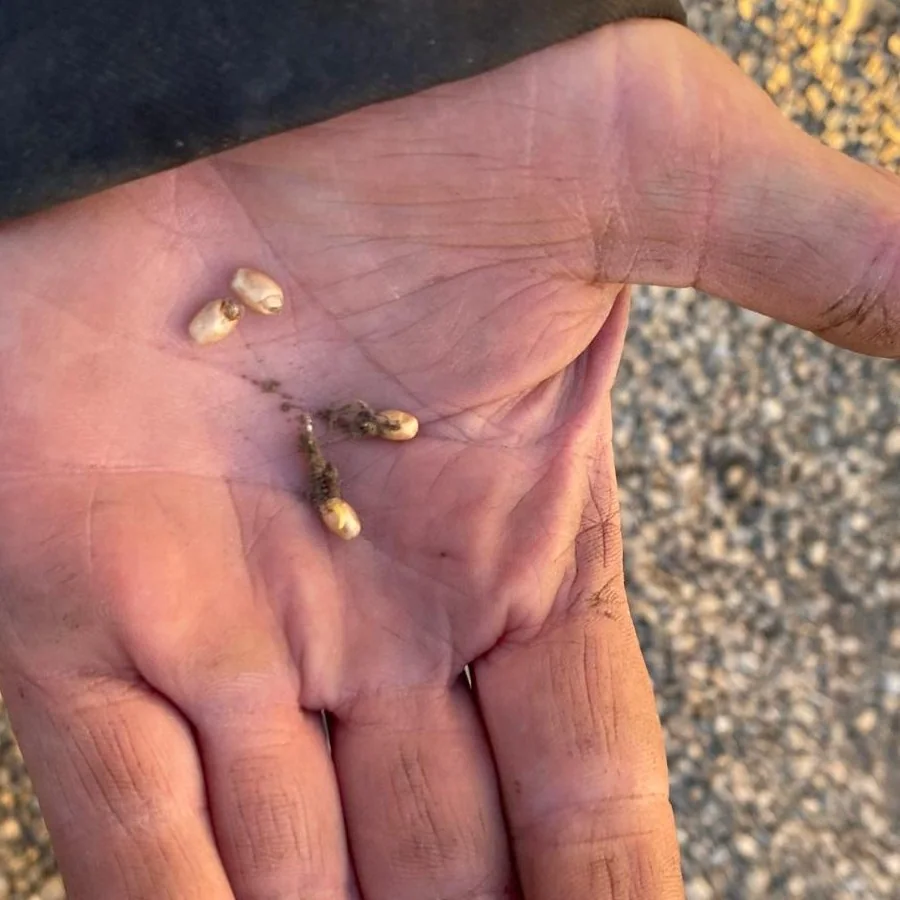
No new equipment necessary. No more seed treatments or inoculants. No more fertilizer. The Bio-Agtive tank pulls from three sources: the combusted carbon from your engine, the heat that it produces, and Bio-Agtive Carbon Water (BCW) that is fed into the system. Carbon, CO2, minerals, microbes, and moisture route onto that seed, creating a powerful and rapid start to germination.
01
Solubilized microcarbons & CO2
Carbon, minerals, microbes and gases from combustion, upcycled onto the seed surface and into soil.
02
Minerals
The mineral fraction of combustion rides along with the carbons to boost soil fertility.
03
Microbes
Living biology, enzymes and natural acids applied directly to the seeds and seasonal N fixation begins.
04
Humidification
Seed coat gains moisture at contact, the step every seed needs to break dormancy.

inoculant
2012
NRC / IRAP
Final Report
Seed microbiology & field mycorrhizal colonization
Bio-Agtive treated seed across lentils, wheat, peas, and mung beans germinated better than untreated seed. Field mycorrhizal colonization measured 40.0% on Bio-Agtive against a 70% guide value, versus just 2.0% on fertilizer-only soil.
Figure 2.1 — Germination & seed colony counts (relative)
NRC / IRAP Final Report (2012).
Figure 2.2 — Field mycorrhizal colonization (%)
CIAAF field colonization analysis; 70% guide value.
03 — A Different Starting Point
What if conventional thinking has misguided our understanding of plant physiology?
Conventional ag feeds the plant: drop nitrogen at the root, let it take what it needs. The regenerative answer feeds the soil instead, building organic matter through compost and costly amendments. Bio-Agtive starts somewhere else entirely.
Bio-Agtive crops exhibit an enhanced epigenetic response, beginning at the seed stage, compared with conventional fertilizer-driven growth or the soil baseline. Only the plant can send a precise biochemical signal, such as a root exudate, to a microbe. Your crop knows what it needs and recruits for it.
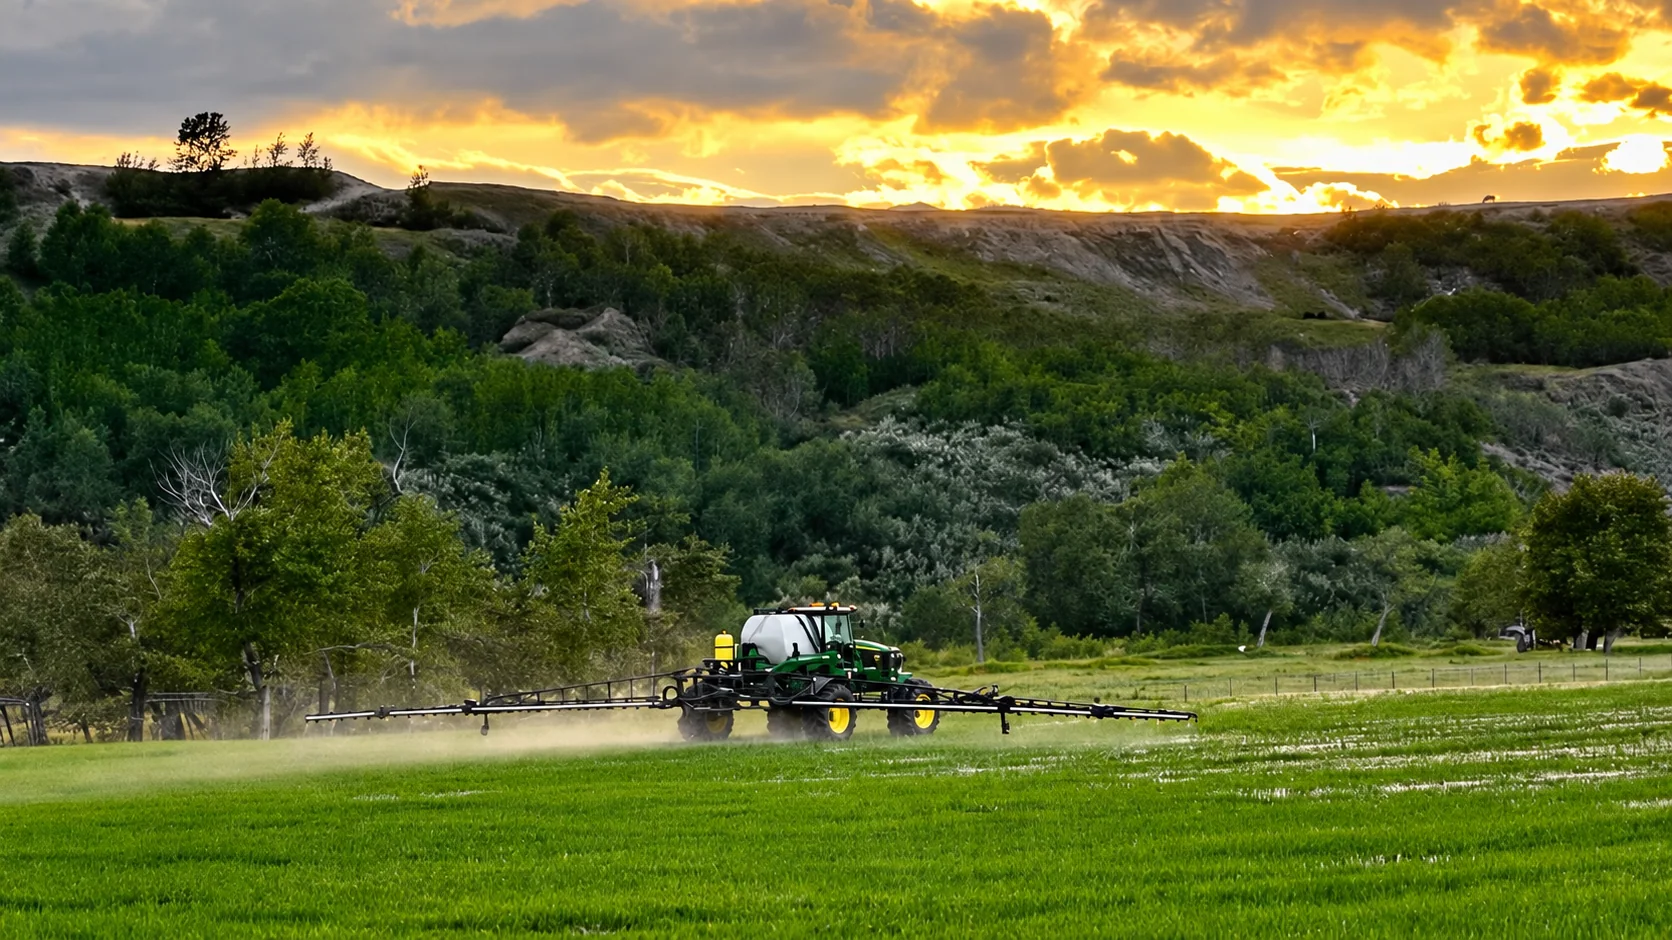
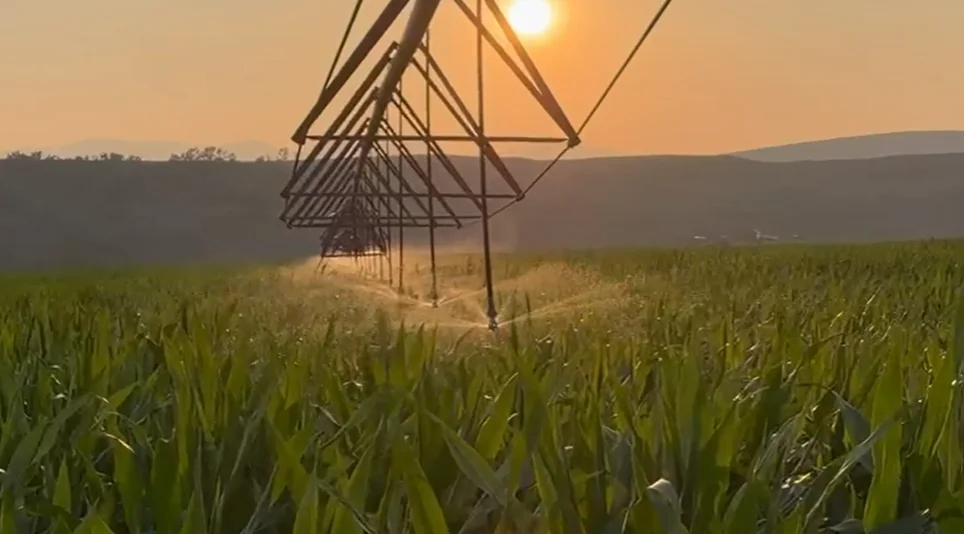
Surface area contact is the genius of the Bio-Agtive delivery mechanism. There is no better, nor more relevant way to disperse a biological input into a crop production zone than Bio-Agtive, due to the carbon vaping mechanism of your farm equipment input system.


Therefore, to adopt this method on your farm, your goals become:
- 1
Invigorate the seed with Bio-Agtive's unmatched seed treatment method to send roots deep in search of water and nutrients, while shoots rise above ground seeking the energy from the sun.
- 2
In place of any synthetic fertilizer, allow the plant to tap the sun's energy and CO2 in order to feed soil organic compounds on its own terms to drive what it needs from the soil; notably, seasonal and biological nitrogen fixation is assured by soil microbes feeding on these exudates.
- 3
Observe the evidence that the plant-soil relationship now has governance over your crop production and functional soil health.
04 — Plant Physiology & the Influence of Biological Nitrogen
Do you deliver dinner to your kids while they sit in front of the TV?
Conventional ag runs on a costly, fossil fuel-powered system: nitrogen arrives pre-packaged as synthetic salts. The plant doesn't earn it. Luxury-fed, it has no need to call on the soil, so it stops sending carbon and signals to the microbes at its roots.
The Bio-Agtive approach runs on the power of the sun: with no synthetic NH4+ sitting at the root, the plant does what it evolved to do — divert fixed carbon to the root zone and feed the free-living nitrogen-fixers already there. That carbon is the signal, and the whole ecosystem goes to work. Fast.
The plant is luxury-fed
Stored chemical energy, delivered. The signal to the root zone goes quiet. Microbial populations decline. The grower corrects what follows — lime, fungicide, pesticide.
The plant works
The plant has to actively seek this form of nitrogen. It releases organic acids around its roots, altering soil pH to reach an optimal range of nutritional availability and microbial activity.
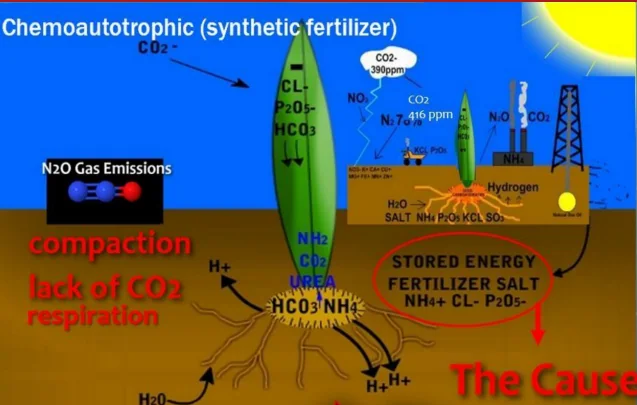
- Ammonium (NH4+) is the easy nitrogen, so the plant switches off carbon building
- Photosynthetic activity drops and roots release less carbon to feed soil microbes; therefore, they die or flee the root zone
- Chloride uptake closes stomata and blocks CO2 from entering the leaf
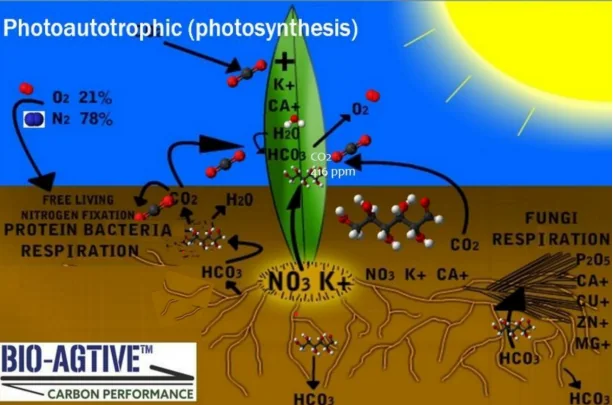
- Sun energy drives photosynthesis, and roots feed bacteria and fungi with carbon
- Microbes fix nitrogen as nitrate (NO3-), which inhibits chloride uptake
- The crop takes up positively charged minerals, driving crop nutrition
The electrical trade behind each nitrogen pathway
No one rewrites the rules on electrical charge. Taking up nitrogen as NO3-, the plant has to compensate — producing more than double the organic acids of a plant fed synthetic NH4+.
Figure 4.1 — Cation and organic acid output as root exudates according to nitrogen source (NO3- vs. NH4+)
Van Beusichem et al. (1988). Organic acids is calculated, not measured directly — the gap between Total Cations and the other measured anions.
>2x
organic acid outputs from the roots when nitrogen is sourced biologically rather than from synthetic fertilizer
Cation Exchange Capacity (CEC) matters
Soil particles carry a negative charge, which holds cations — the ion forms of potassium, calcium and magnesium (K+, Ca2+, and Mg2+) — in reserve until a root needs them; that's CEC. More exudate, exactly what NO3- nutrition drives, means more trade, means more nutrients actually pulled from living soil.
You could never apply enough microbes from any commercial product to move this system on your own. It all begins with the elimination of ammonium and landing solubilized carbon from emissions onto your seeds to orchestrate a full switch to biologically fixed nitrogen.
05 — The Measurable Result
Living soil falls into line rapidly once it's clear the plant is driving the system.
Corn, a C4 crop, performs exceptionally well under the emissions method. Grown side by side against synthetic fertilizer, with rhizosphere microbial mass tracked weekly for 14 weeks, Bio-Agtive plots ran 77–137 µg C/g soil against fertilizer's 71–112.
Figure 5.1 — Rhizosphere microbial mass, corn (µg C/g soil)
ATG / Bio-Agtive farm trial data collection, Corn tab.
Fertilizer doesn't just fail to build microbial mass — it actively suppresses it. A 2021 Rothamsted Research wheat study measured the share of Plant Growth-Promoting Rhizobacteria (PGPR) on wheat roots: 91% on unfertilized roots, collapsing to 19% the moment fertilizer was added.
91%
root bacteria were growth-promoting (PGPR) on unfertilized wheat — Rothamsted, 2021
19%
what that PGPR share fell to once fertilizer was applied to the same wheat
54–63%
of belowground crop carbon came from rhizodeposition (root exudates) under biological farming — Swiss trials, 2018
Furthermore, long-term Swiss field trials (2018) using 13C pulse-labelling found biological systems route 10–20% more total carbon belowground than synthetic systems, with rhizodeposition making up 54–63% of that belowground carbon under biological management.
06 — pH Matters
Below pH 6 in your soil, nutrient availability slides hard.
The science backs it up in this independent trial (Figure 6.1). The Bio-Agtive performance below in Figure 6.2 mirrors this independent result.
Figure 6.1 — Root-zone pH, sorghum (by N source, over 7 days)
Clark, R.B. (1982), Figure 2.21.
5.5 → 6.5
root zone pH rise under NO3- nutrition
< 3.0
root zone pH by day 7 under NH4+ nutrition
A farm trial running corn side by side under Bio-Agtive and fertilizer measured rhizosphere pH weekly across the season. The two treatments start close together early on; partway through the season the lines separate and don't come back together. Bio-Agtive climbs through to harvest; fertilizer rises more slowly, to a lower ceiling.
Figure 6.2 — Root-zone pH across the season, corn
ATG / Bio-Agtive farm trial data collection, Corn tab.
pH decides which nutrients a root can actually reach. Phosphorus doesn't vanish at low pH — it binds to iron and aluminum, locked out of reach. Iron, manganese, copper, and zinc do the reverse, going scarce as pH climbs past neutral.
Nutrient availability across soil pH
Soil pH — wider band = greater availability
pH matters most in the rhizosphere, the few millimeters around the root where exudates and microbes concentrate. The organic acids are balancing NO3- uptake and shifting local pH toward the range where the broadest set of nutrients opens up.
07 — At the Molecular Scale
Small carbon, doing outsized work.
No fertilizer… just solubilized microcarbon from emissions, microbes, and natural acids; it all starts to add up to available nitrogen season after season.
This scientific study demonstrated that carbon dots — engineered nanoscale carbon — applied to Azotobacter chroococcum, a free-living nitrogen-fixer, increased its nitrogen-fixing activity by 158% against an untreated control. The nanocarbons interact directly with nitrogenase, the enzyme behind atmospheric nitrogen fixation, improving electron transfer inside the process itself.
158%
increase in nitrogen-fixing activity in Azotobacter chroococcum, treated with carbon dots
ACS Applied Materials & Interfaces, 2018
08 — The Number That Reframes Everything
98% of what you grow comes from
thin air anyway!
Nitrogen typically makes up 2 to 3% of total grain energy on its own. Add it to carbon dioxide, hydrogen, and water, and these four (N2, CO2, H2O, H) — all sourced from the air and the sky — account for 98% of total grain energy. The remaining 2%? That's what you actually removed from the soil. Take note that your roots and residues will handily replace such an insignificant amount of fertility.
90%
of a wheat grain's total energy comes from CO2 — captured from the air, not the soil
6%
comes from hydrogen and water, arriving as wind and rain
2 to 3%
is the nitrogen, and where we derive our protein for food and feed
Biological nitrogen fixation, by system
| Crop / System | N Fixed (lbs/acre) |
|---|---|
| Legumes (symbiosis) | 50–400 nodulated; 20–300 non-legume nodulated |
| Corn & tropical plants (associations) | 10–200 |
| Grains, incl. wheat (free-living) | 1–2 heterotroph; 10–80 autotrophs |
Source: adapted from K. Isermann, Table 7.1 — type, energy source, and fixation capability of biological N2 fixation systems in soils.
A crop that is managed to fix its own nitrogen from gases in the air is the program. Supporting the plant's own capacity to convert CO2, CH4, and N2O into usable plant and microbial inputs is what replaces the synthetic fertilizer that you currently buy (rent).
Sources
- Van Beusichem, M.L. et al. (1988). Cation-anion balance and nitrogen source effects on organic acid accumulation — castor bean.
- Hirte, J., Leifeld, J., Abiven, S., Oberholzer, H.-R., & Mayer, J. (2018). Belowground carbon inputs to soil via root biomass and rhizodeposition of field-grown maize and wheat. Agriculture, Ecosystems & Environment, 265, 556–566.
- Reid, T.E. et al. (2021). Inorganic Chemical Fertilizer Application to Wheat Reduces the Abundance of Putative Plant Growth-Promoting Rhizobacteria. Frontiers in Microbiology, 12, 642587. Rothamsted Research.
- Mauchline, T.H., Reid, T.E. et al. (2024). Follow-up study on PGPR abundance in modern vs. wild wheat ancestors. Rothamsted Research.
- Wang, H. et al. (2018). Carbon Dots Enhance the Nitrogen Fixation Activity of Azotobacter Chroococcum. ACS Applied Materials & Interfaces, 10(19), 16308–16314.
- Isermann, K. Table 7.1 — type, energy source, and fixation capabilities of biological N2 fixation systems in soils.
- NRC / IRAP (2009). Field Study Results 2009 for Bio-Agtive Emission Systems. Earthspirit Land Resource Consulting, prepared for NRC / IRAP.
- NRC / IRAP. Final Report. Bio-Agtive Emissions Technology. Montana State University Northern BioEnergy Center.
- Maki, R. (2023). BioAgtive Final Project Report 2022. Olds College Centre for Innovation.
- University of Calgary Carbon Summer Team (2024). Yield & ROI Results, Dougan Farm.
- Norman, A-L. et al. (2023). Bio-Agtive, AGU Poster, Strathmore trial.
- Clark, R.B. (1982). Figure 2.21, sorghum nitrogen source pH trial.
- ATG / Bio-Agtive farm trial data collection — Corn tab.
Full reports available on request.